

Trustrorthy AI
Knowledge Base
Integration
Integration includes (left to right in the diagram) technology-specific integration services such as OneLake shortcuts in Microsoft Fabric, virtual tables in Microsoft Dataverse, event-driven integration services such as Event Grid and Service Bus, use of APIs via API Management, logic driven integration such as Logic Apps and Azure Functions, batch integration relying on Azure Data Factory, and enterprise master data management (MDM).
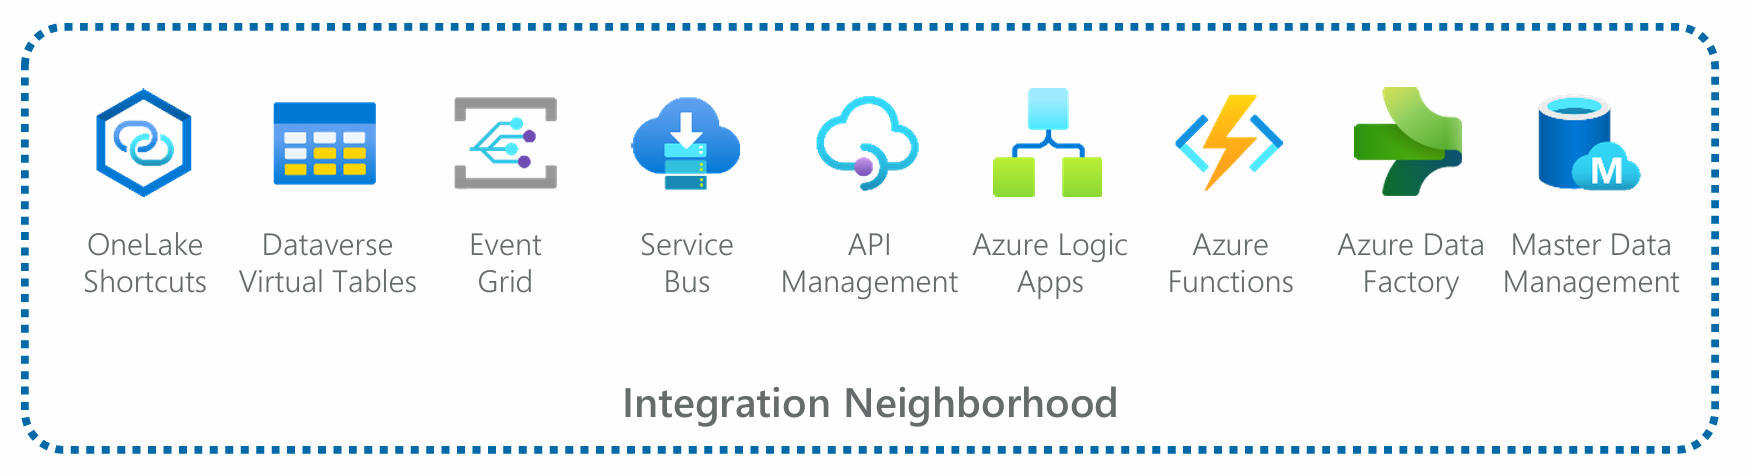
Figure 15: A magnified view of the Integration Neighborhood from the Reference Ecosystem.
A lineup of icons does not an architecture make, of course. An Integration Neighborhood - also known as “integration platform” or an “integration layer” - can be incredibly architecturally complex. Organizations that have not already established one using some combination of these and related technologies, alongside best practices and patterns reusable across their ecosystem, will certainly want to do so in order to facilitate data consolidation and scale AI.
The organization’s AI strategy, however, need not be concerned with architectural specifics at a detailed level, rather with establishing and maturing their Integration Neighborhood, and normalizing its use across the ecosystem to avoid the types of “spaghetti web” integrations that are costly to maintain and the antithesis of what AI needs to scale.
Business Applications
Our Business Applications dimension broadly consists of two neighborhoods from the Reference Ecosystem:
• Core Business Systems which includes the “Tier 1” business applications common in many organizations such as ERP, CRM, HRMS, etc.;
• Application Portfolio which may include “Tier 1” applications, but often includes solutions aimed at smaller audiences or more niche business processes of the Tier 2 (“business important) and Tier 3 (“productivity”) variety.
Modern business applications are important to the enterprise AI strategy because they are both (a) the user experience or touchpoint that most business users have with the technology ecosystem, and (b) often the principal generator of data, or collection point for the organizational data upon which AI will rely.

The Core Business Systems Neighborhood shown here from the Reference Ecosystem includes custom applications built atop Azure SQL and Power Platform, CRM in Dynamics 365, ERP in SAP, and HR in Workday. These are illustrative examples of the many solutions organizations rely upon in their core business systems neighborhood. We’ve also included references to migrating legacy workloads to technologies whose underlying data sources (Dataverse, in the case of both Dynamics 365 and bespoke Power Platform solutions) are easily consolidated into our Data Distribution Neighborhood.
Yours may look very different, and that’s (probably) just fine.
We’ll spare you a lengthy discussion of core business systems, here, and say only that (a) use of modern data services that are readily accessible by AI such as Azure SQL and Dataverse are ideal, and (b) over-fragmentation of core business systems, which is to say, the use of many different technologies and vendors in the Core Business Systems Neighborhood, can introduce unwelcome barriers to AI adoption including added integration needs between systems, denormalized data structures across the ecosystem, and disparate security models.
Figure 16: A magnified view of the Core Business Systems Neighborhood from the Reference Ecosystem including legacy workloads to be migrated to modern, future-ready technologies Power Platform and Dynamics 365 (apps that sit atop Power Platform).
The Application Portfolio Neighborhood receives separate treatment from its core business systems counterpart.
This is to distinguish between the business important and team productivity solutions often residing in the former, and the business-critical workloads that reside in the latter.
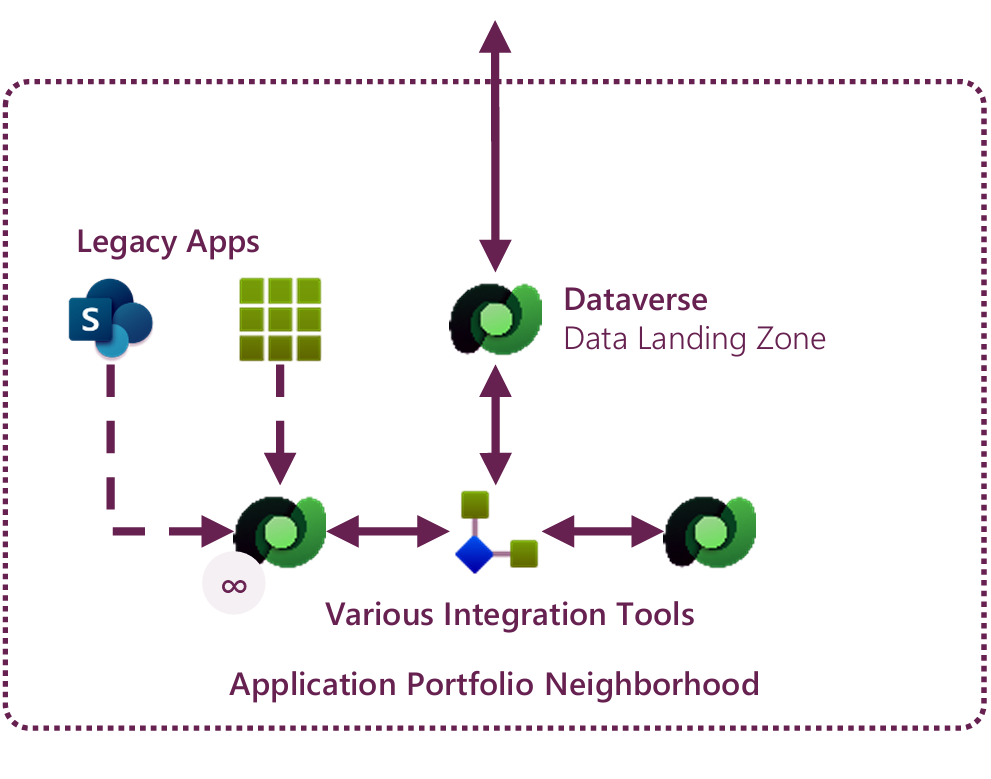
Figure 17: A magnified view of the Application Portfolio Neighborhood from the Reference Ecosystem, including the need for legacy “SharePoint” apps to be migrated to modern, secure technologies such as Dataverse.
We see the application portfolio as relevant to an organization’s AI strategy for two reasons - one of opportunity and the other of risk mitigation:
• First, most organizations are littered with dozens, hundreds, even thousands of apps in this Tier 2-3 space. Many contain more trivial datasets that are either not relevant to AI (at least for the moment) or too unwieldy to consolidate. Many, though, transact data that could be quite valuable in AI scenarios, but has previously been kept in data sources that are inaccessible to AI;
• Second, many organizations have overengineered applications (Power Apps atop SharePoint and older style “SharePoint apps” themselves) that sit atop SharePoint lists as their data source. SharePoint may be appropriate as a data store for small apps that don’t transact sensitive data but is wholly inappropriate for apps that require any degree of security. Data in these lists also hydrates the Microsoft Graph with data consumed by Microsoft 365 Copilot, which creates a significant security risk when sensitive data is stored there.
In both cases, your AI strategy ought to reflect moving large chunks of application portfolio data into Power Platform solutions built using Dataverse as a data orchestration layer either to facilitate the secure consolidation of data to the Data Distribution Neighborhood, or to secure data from inadvertent leakage altogether.
Then there is the discipline required to maintain a healthy data platform over time, for example by avoiding the temptation to revert to the legacy pattern of siloed, inconsistent data services or point-to-point integration. Instead, architecting individual applications such that they don’t run off and spawn a new generation of one-off data siloes, just as you’ve exorcised the data demons of your past, maintaining the index across your estate, etc. Today’s generation of low code services, such as Microsoft’s Power Platform, can help immensely.
Forrester’s 2022 study, The Total Economic Impact of Microsoft Power Platform Premium Capabilities, found 63% of IT decision makers reported that Power Platform helped them eliminate or rein in shadow IT, which is good news for an AI-powered future where data consolidation, governance, security, etc. is paramount.
In fact, it is difficult to scale AI across an ecosystem-oriented architecture absent of Power Platform for three reasons:
1. Power Platform enables software and data engineers to build workloads faster, whilst simultaneously allowing non-technical “citizen developers” the ability to self-service many of their own productivity needs in a safe, secure way (thereby freeing professional engineering time to focus on more complex workloads);
2. Every organization we have ever encountered has vast swathes of its data estate buried in the types of productivity solutions (e.g., spreadsheets, Access databases, small third-party “shadow IT” solutions) that are not addressable by AI because they are not consolidated. As such, it is cost and time prohibitive to bring these data out of the shadows and to address the tier one and tier two workloads with professional engineering talent alone;
3. Microsoft is building AI capabilities into Power Platform itself, essentially making Power Platform as indispensable an ingredient to your AI strategy as Azure AI Search and Azure AI services themselves. For example:
a. Copilot Studio, Microsoft’s service for organizations building their own agents, is built atop what was previously known as “Power Virtual Agents,” which is architecturally ingrained with Power Platform. In other words, we now build agents in Power Platform itself;
b. Power Platform includes AI capabilities that developers can embed into their solutions, allowing users to, for example, chat with the app and have AI-driven insights returned to them using data in the application itself;
c. Investing in and standardizing Microsoft Dataverse (the principal data service underlying Power Platform solutions) as your first port of call for transactional application data. This offers a repeatable pattern where apps are built atop a data service that, in one hop, consolidates data into the lake. This pattern is readily applicable to tier one or critical core business systems as well as to tier two and three (or below) - more productivity centric - applications.
Let’s explore an applied example of this.
The diagram below shows a series of workloads (blue icons) each representing an “app,” or a series of apps, placed in the hands of various users in a typical globally distributed organization. Note that most of these workloads would be classified as “core business systems”, though different organizations may prioritize each of its functions in different ways. These workloads use Microsoft Dataverse as their “single source of truth” for transactional application data.
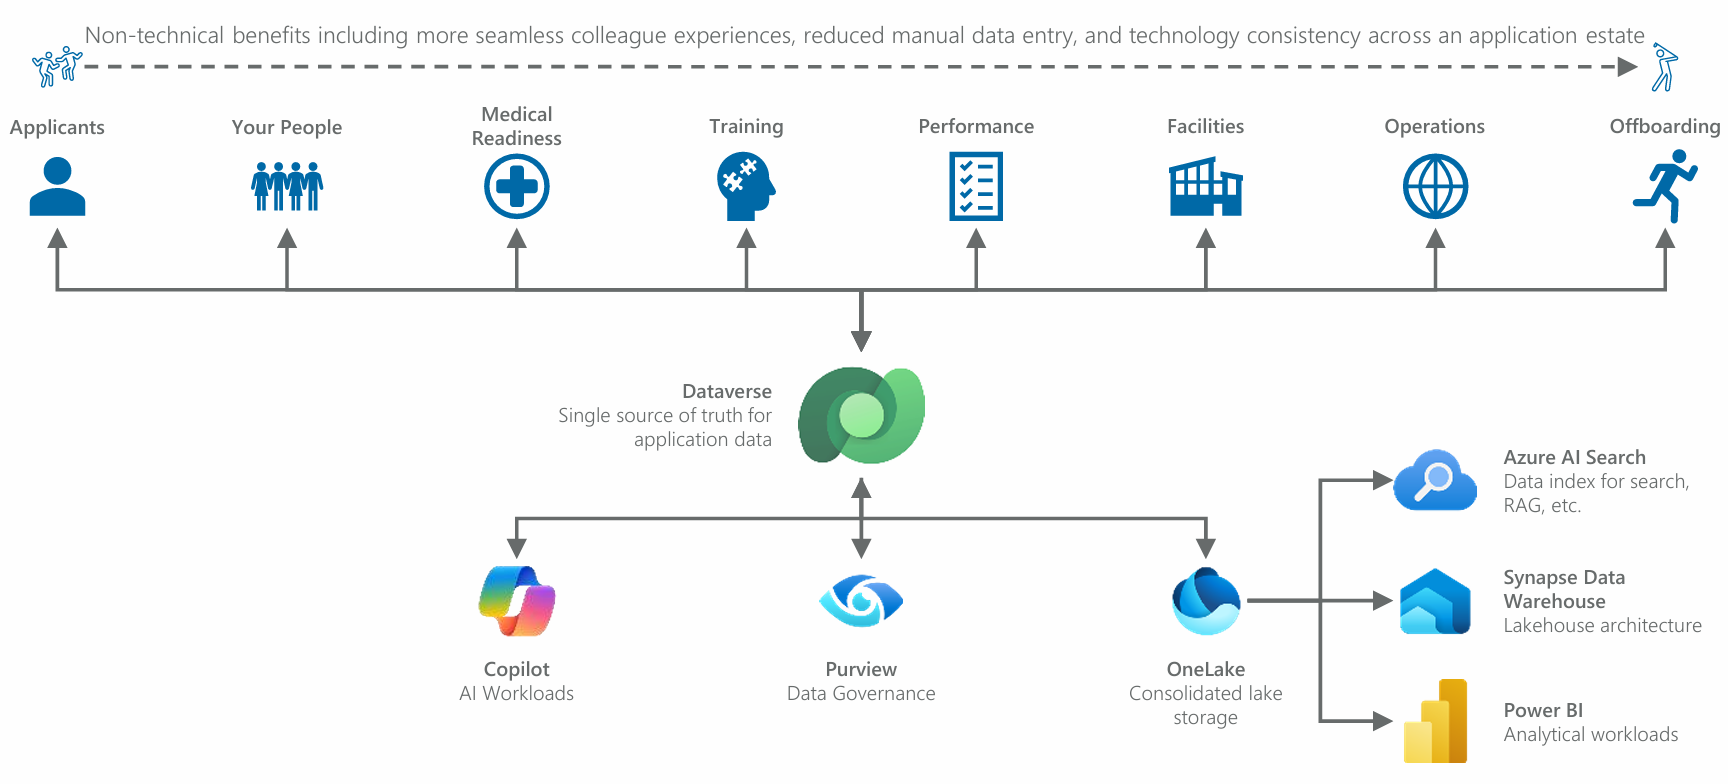
Figure 18: Different workloads (blue icons) that might typically be found in an enterprise organization. The map is illustrative, though it’s highly likely that most organizations will see something of their own needs here.
Try to take this in without getting hung up on the specifics of each workload. This diagram depicts a generic organization that could be found in nearly any industry. It’s really a composite of workloads that I have personally been involved with implementing in sectors as diverse as financial services, professional services such as big law firms, manufacturing, retail and distribution, emergency services (e.g., law enforcement, medical, rescue, coast guard, etc.), the military, and other public sector and non-governmental organizations that deploy or maintain personnel globally.
For example, the “Medical” workload may not be relevant to an insurance firm, but is certainly relevant to a law enforcement agency, the military, or even an industrial firm where safe operation of heavy equipment is a concern. We could have easily substituted that “Medical” workload in favor of an “Underwriter Workbench” workload for an insurance firm.
Now let’s reshuffle those workloads and combine them with the RAG pattern discussed previously.
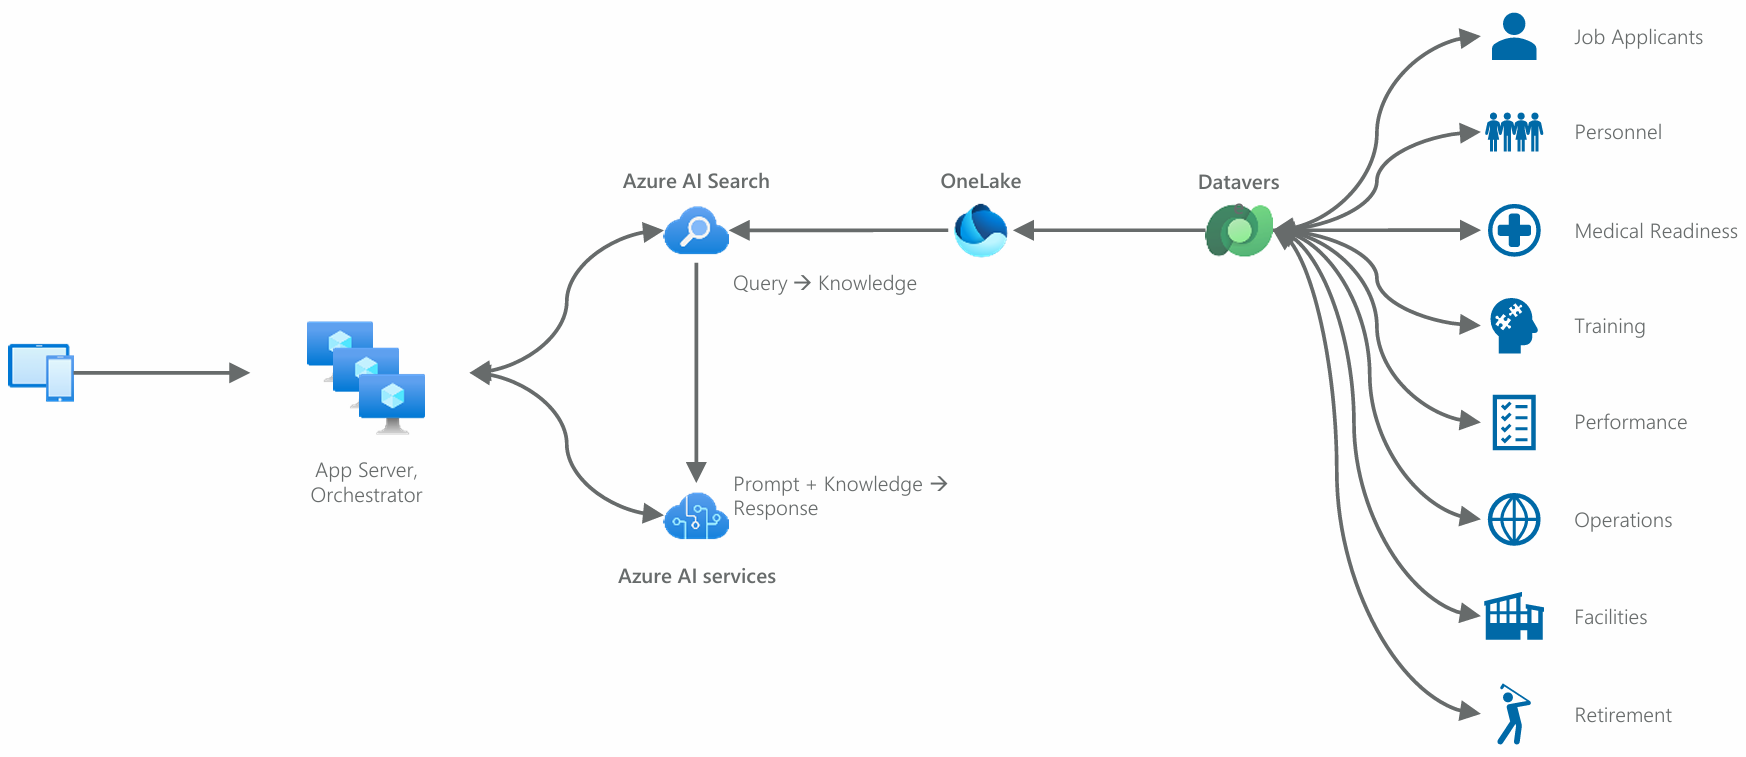
Figure 19: Functional workloads (blue icons) from our previous diagram have been arranged with Dataverse and combined with our AI architecture to demonstrate how this data may flow to AI workloads.
Each of these workloads can be built with Power Platform. So, as you can see, Power Platform operating alongside Azure AI services and Azure data services (Microsoft Fabric) makes for a compelling combination. Modernizing both tier 1/2 and productivity “shadow” apps to Power Platform provides outsized value in scaling AI across the organization, plus many other benefits of this app modernization approach (which are new stories for other times).
For example, the “Medical” workload may not be relevant to an insurance firm, but is certainly relevant to a law enforcement agency, the military, or even an industrial firm where safe operation of heavy equipment is a concern. We could have easily substituted that “Medical” workload in favor of an “Underwriter Workbench” workload for an insurance firm.
Now let’s reshuffle those workloads and combine them with the RAG pattern discussed previously.