

Trustrorthy AI
Knowledge Base
Ecosystem Map
An ecosystem map is a high-level architectural diagram of an organization’s cloud ecosystem, and something that every organization ought to create at the start and continuously evolve as they progress on their AI journey.
The “map” metaphor is instructive here. It is used to distinguish an ecosystem map from the various forms of architectural diagrams, nearly all of which tend to include more technical minutiae than a typical ecosystem map. Whereas an architectural diagram provides specific parameters for specific technical solutions, an ecosystem map presents a higher-level, more visionary view of an organization’s cloud ecosystem.
To make an analogy to architecture in the physical world:
• Solution architecture provides schematics - floor plan, dimensions, electrical wiring, ventilation, plumbing - from which a building is constructed;
• Enterprise architecture provides plans for specific neighborhoods or systems such as a subway or electrical grid;
• Ecosystem architecture and, by extension, an ecosystem map shows us the entire city.
Thinking of an organization’s cloud ecosystem as a city, we then conceptualize the next-level down component parts of the ecosystem as “neighborhoods” (we might have also called them “boroughs”). Cities the world over are pieced together this way: Downtown, Seaport, Southie, etc. in Boston; Greenwich, Soho, Canary Wharf, etc. in London (though you’re forgiven if you thought I was talking about New York until you got to “Canary Wharf”); Palermo, Recoleta, Puerto Madero, etc. in Buenos Aires; Norrmalm, Gamla Stan, Kungsholmen, etc. in Stockholm. The list goes on.
Each of these neighborhoods share the quality of dividing their city into smaller pieces, each often with their own distinct culture, aesthetic, or purpose.
Like cities, ecosystem maps are constantly evolving and changing. To prevent your ecosystem from becoming overcrowded, stagnant, or unable to meet the needs of its expanding 'population,' it's essential to revisit, revise, and adapt your Ecosystem Map on a regular basis.
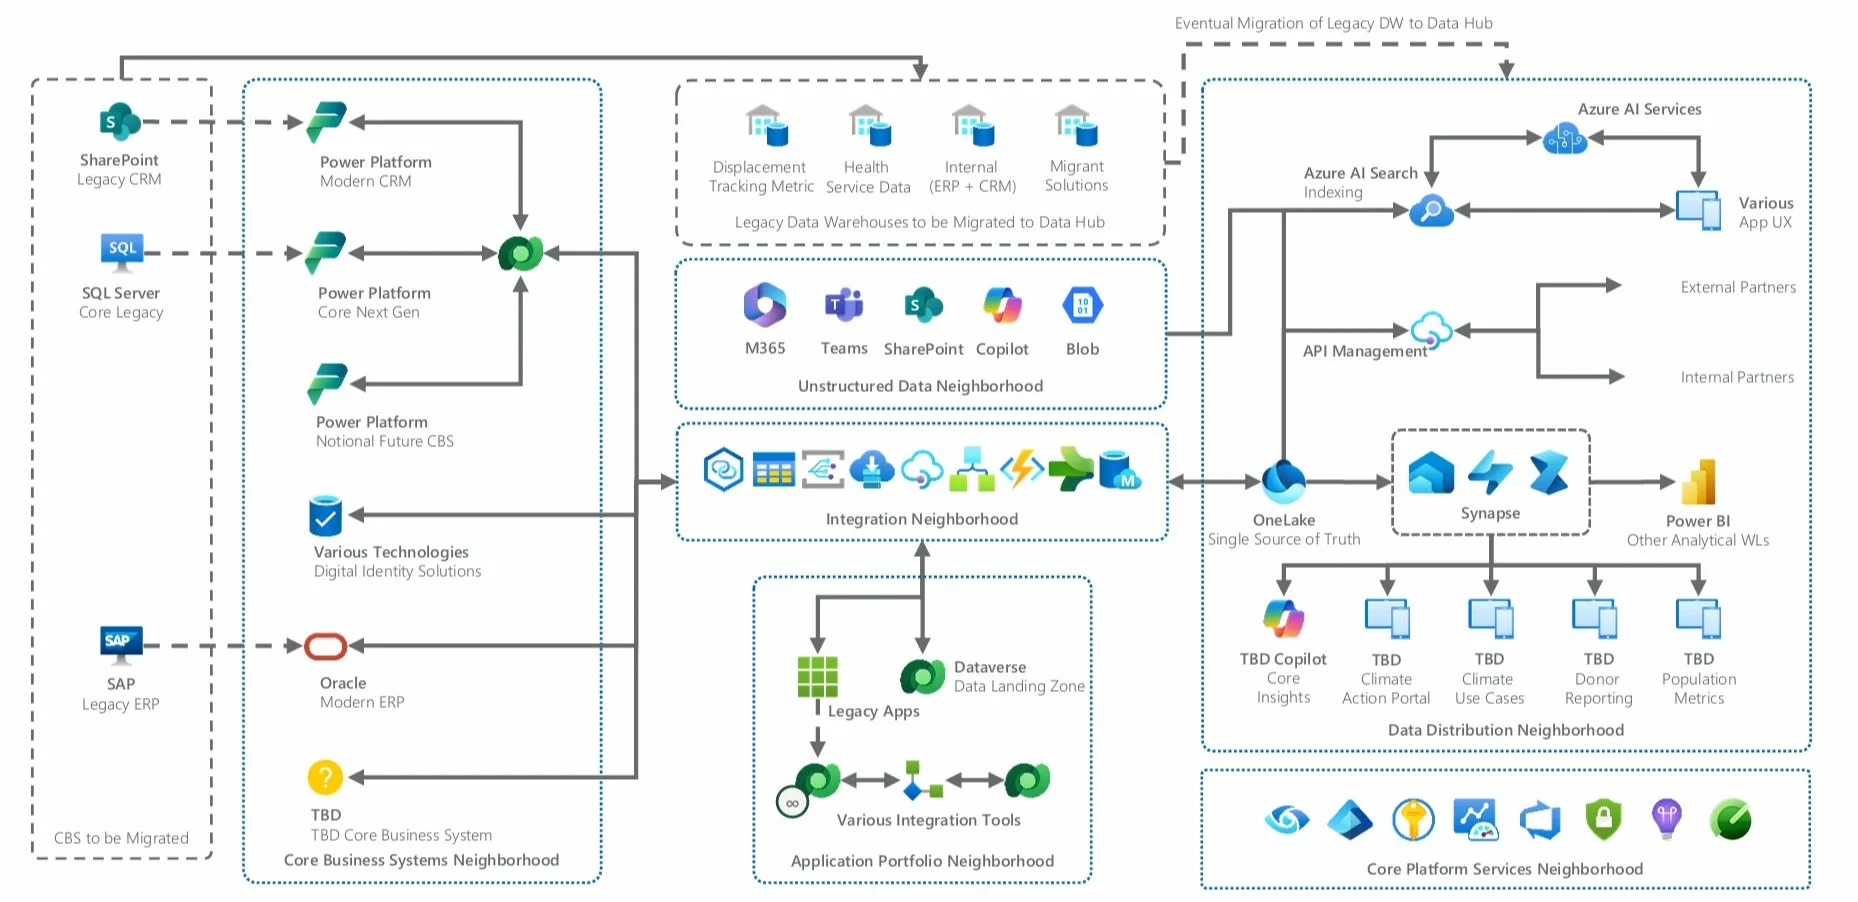
The example above is one of our recent favorites produced in collaboration with a global enterprise organization as part of their AI and broader cloud strategy. Note that:
• Specific AI and other data products are identified in the Data Distribution Neighborhood (bottom of the box on the far right);
• The ecosystem map shows how data will flow from the organizations’ core business systems (including some yet to be identified, which is just fine) and application portfolio such that it hydrates various data distribution points, including but not limited to AI workloads;
• Migration of legacy applications and legacy data warehouses is identified as a priority - a part of data consolidation that we will discuss later.
Mapping the cloud ecosystem is a key element of our AI strategy because the efficacy of any AI workload is directly related to the quality of the data upon which the workload’s model is trained or augmented. Think back to our earlier foundational discussion of how generative AI acts on enterprise data. Mapping, evolving, and maintaining the organization’s cloud ecosystem map provides the essential high-level technical architecture underpinning our AI strategy.
An ecosystem map is part of a broader approach to what we call ecosystem-oriented architecture (EOA) that we will discuss more deeply as part of the Ecosystem Architecture pillar in the next section.